Make Sense of Math: Middle School Math Topics
Showing posts with label Middle School Math Topics. Show all posts
How to teach the Pythagorean Theorem conceptually before introducing the formula

How to Teach the Pythagorean Theorem Conceptually (Before the Formula)

If you teach 8th grade math, Algebra, or Geometry, you know students can memorize a² + b² = c² without necessarily understanding what it means.

Quote about understanding the Pythagorean Theorem before memorizing the formula

If you start with the formula, many students simply plug in numbers. Later, they may forget which sides to use or when the formula applies.

Instead, begin with the visual relationship. Here's how to teach the Pythagorean Theorem conceptually so the mathematics makes sense.

Start with the Big Idea (No Formula Yet)

Before presenting the formula, help students explore the relationship between the areas of squares built on the sides of a right triangle.

  • The Pythagorean Theorem compares the areas of three squares.
  • The sum of the areas of the two squares on the legs equals the area of the square on the hypotenuse.

Say it simply: The areas of the squares on the two shorter sides add up to the area of the square on the longest side.

Use Visual Models First

Visual model of three squares on a right triangle illustrating the Pythagorean Theorem

This is where understanding begins. Draw a right triangle, build a square on each side, and label or shade the areas. Let students explore how those areas are related.

  • Draw a right triangle.
  • Build a square on each side of the triangle.
  • Shade, count, or label the area of each square.
  • Compare the areas of the two smaller squares with the largest square.

You can use grid paper to count squares, paper models to rearrange pieces, or digital manipulatives to investigate the relationship.

Let Students Discover the Pattern

Analyze a few right triangles before telling students the relationship. Try triangles with side lengths 3, 4, 5; 6, 8, 10; and 5, 12, 13.

Ask students:

  • What do you notice about the areas of the squares?
  • What relationship stays true each time?
  • How could you describe the pattern in your own words?

Let students articulate the relationship before you formalize it.

Then Connect It to the Formula

Now introduce a² + b² = c² and connect every term directly to the area model.

  • a² is the area of the square on one leg.
  • b² is the area of the square on the other leg.
  • c² is the area of the square on the hypotenuse, the longest side.

When students understand the relationship between the square areas, the formula becomes a meaningful representation rather than a collection of symbols.

Use Real-World Context

Once students understand the theorem, connect it to familiar situations.

  • Finding the diagonal of a rectangle
  • Finding the distance between two points on a coordinate grid
  • Determining a straight-line distance across a rectangular space

You don't need to overload students with applications. A few well-chosen examples help them recognize when the theorem is useful.

A Common Mistake to Avoid

Starting with “Here's the formula—plug in the numbers” can encourage students to memorize without understanding. That may lead to confusion about which side is the hypotenuse, when the theorem applies, or why it works.

Build the visual understanding first. Then move toward the abstract formula and efficient problem-solving.

Pythagorean Theorem Anchor Charts

These Pythagorean Theorem Anchor Charts include visual models, proofs, and examples to help students connect conceptual understanding with the formula.

Pythagorean Theorem anchor charts with visual models

Save This Pythagorean Theorem Lesson Idea

Save this visual approach for your 8th grade math or Geometry unit.

How to teach the Pythagorean Theorem conceptually using square area models
Teaching solving algebraic equations using bar models

Teaching Solving Algebraic Equations with Bar Models

Solving algebraic equations can feel overwhelming for many middle school students, especially when instruction focuses only on steps and procedures. Bar models offer a simple way to make equations more visual and meaningful.

Instead of asking students to memorize what to do, bar models help them understand what the equation represents.

Why Use Bar Models in Algebra?

Bar models allow students to see the structure of an equation before solving it. This helps students:

  • Identify what is known and unknown
  • Understand relationships between quantities
  • Feel more confident when solving equations

When students can visualize an equation, the math often starts to make sense.

Start with One-Step Equations

Bar model for the equation x plus 7 equals 19

For an equation like x + 7 = 19, have students draw one bar to represent 19 and split it into two parts. One part is 7, and the other part is x.

Students can see that x is the missing piece. The model shows how the quantities are related before students move to algebraic notation.

This approach reinforces that solving equations is about finding an unknown value, not simply following rules.

Use Bar Models for Multiplication and Division

Bar model showing three equal parts for the equation 3x equals 42

Bar models also work well for multiplication equations such as 3x = 42.

Students draw a bar divided into three equal parts that total 42. Each part represents x. From the model, students can see why dividing by 3 makes sense.

This visual support is especially helpful for students who need a bridge between concrete quantities and abstract equations.

Connect the Model to the Equation

After drawing a bar model, ask students:

  • What does each part represent?
  • Which part is unknown?
  • How could this be written as an equation?

These questions help students connect visual models to algebraic notation.

Visual Supports Make a Difference

Consistent visuals can help students remember strategies and build independence. Anchor charts and posters give students something to refer to as they solve equations.

I created Solving Equations with Bar Models Anchor Charts and Posters to support this work. The charts show how to model and solve addition, subtraction, multiplication, and division equations using bar models.

Solving equations with bar models anchor charts and posters

Final Thoughts

Bar models help students slow down, think, and understand what an equation means. When students understand the structure, solving becomes less intimidating.

If you're looking for a way to strengthen algebra instruction, bar models are a strategy worth adding to your classroom.

How understanding unit rate helps students master slope in middle school math

How Understanding Unit Rate Helps Students Master Slope

When teaching slope in middle school math, many students struggle to connect the concept to real-world situations. One powerful way to build understanding is through unit rate, a concept they've likely encountered in earlier grades.

Helping students connect unit rate and slope makes linear relationships more intuitive and meaningful.

What Is Unit Rate?

Unit rate compares two quantities when one of the quantities is one unit. Examples include miles per hour, dollars per item, and words per minute.

For example, if a car travels 150 miles in 3 hours, students can calculate the unit rate:

150 miles ÷ 3 hours = 50 miles per hour

This tells us how far the car travels in one hour.

What Is Slope?

Slope measures the rate of change of a linear relationship. It tells us how much the y-value changes for each one-unit increase in the x-value.

Slope = change in y ÷ change in x

For example, if a line passes through the points (2, 4) and (6, 12), we can find the slope:

m = (12 − 4) ÷ (6 − 2) = 8 ÷ 4 = 2

This means the y-value increases by two units whenever x increases by one unit.

How Unit Rate and Slope Are Connected

Slope can be understood as a unit rate of change. Instead of describing miles per hour, it describes the change in y per one unit of x.

Here are three ways this connection helps students:

  • Familiar concept, new application: Students can apply what they already know about unit rates to understanding slope.
  • Consistent mathematical structure: Both concepts involve comparing quantities through division.
  • Real-world meaning: Students can interpret slope as speed, pay per hour, or another meaningful rate of change.

Classroom Strategies to Connect Unit Rate and Slope

1. Use Word Problems First

Before moving to graphs, have students solve familiar unit rate problems.

For example, a babysitter earns $40 in 4 hours. What is the hourly rate? How does this connect to the slope of the equation y = 10x?

2. Relate Graphs to Proportional Relationships

Start with proportional relationships where the constant of proportionality is also the slope. Then introduce linear relationships with a nonzero y-intercept.

Students can compare how the rate of change stays constant even when a graph does not pass through the origin.

3. Have Students Create Real-World Scenarios

Ask students to create and graph situations involving unit rates, such as dollars per hour or miles per gallon. Have them explain the meaning of the slope in each context.

Final Thoughts

Connecting unit rate to slope helps make linear relationships more approachable. Instead of memorizing another formula, students can build on their understanding of ratios and rates.

If you're looking for ready-to-use support, explore my Slope and Graphing Linear Equations Guided Notes in the Make Sense of Math TpT store.

8th grade math guided notes for slope and graphing linear equations

Save These Unit Rate and Slope Teaching Ideas

Save this post to your middle school math Pinterest board for ideas on connecting unit rate and slope.

How unit rate and slope are connected in middle school math
Teaching fraction operations using bar models

How to Teach Fraction Operations Using Bar Models

The key to teaching fraction operations—adding, subtracting, multiplying, and dividing—is to teach conceptually first. Students need to make sense of the math behind fractions before learning shortcuts and algorithms.

Once students understand the models, help them recognize patterns, discover the algorithms, and develop fluency. Let's look at the four operations using fraction bar models.

Adding and Subtracting Fractions

Model each fraction separately. Draw vertical partitions on one model and horizontal partitions on the other.

Starting fraction models with different denominators

Copy the partition lines onto both models to create equivalent fractions with a common denominator.

Fraction models partitioned into equal-sized pieces

With equal-sized pieces, students can now add or subtract the fractions and explain why common denominators are needed.

Multiplying Fractions

Think of multiplication as taking a fraction of another quantity. For example, 3/4 × 1/2 means taking three-fourths of one-half.

Start by representing one-half.

Fraction bar model showing one half

Next, partition that half into four equal parts and represent three-fourths of it.
Fraction multiplication model with overlapping sections

The overlapping region represents the product, three-eighths.

Completed fraction multiplication area model

Dividing Fractions

Before introducing fraction division, revisit the two meanings of division: partitive and quotative.

Partitive division: Eight divided into two equal groups. The quotient of four tells how much is in each group.

Partitive division visual model

Quotative division: Eight divided into groups of two. The quotient tells how many groups there are.

Quotative division visual model

Now use these ideas for 3/4 ÷ 1/2. In a partitive interpretation, 3/4 is one-half of a group. How much makes a whole group?

Partitive division of three fourths by one half

For the quotative interpretation, ask how many groups of one-half fit into three-fourths. The result is one and a half groups.

Quotative division of three fourths by one half

Fraction Operations Anchor Charts

Anchor charts are helpful visual reminders. Fractions appear throughout middle school math, so I kept fraction operations models on my classroom walls. You can also use these Fraction Operations Anchor Charts.

Fraction operations anchor charts and visual models
View the fraction operations anchor charts on TpT

Save These Fraction Models for Later

Save this post to your math teaching Pinterest board for ideas on teaching addition, subtraction, multiplication and division of fractions using visual models.

Teaching fraction operations with bar models
How to teach multiplying and dividing integers conceptually

How to Teach Multiplying and Dividing Integers

I've got some great tips for teaching multiplying and dividing integers. These strategies focus on discovery, making sense of the math, and extending mathematical reasoning.

Helping students understand the patterns behind integer multiplication and division can make the rules more meaningful and easier to remember.

Tip 1: Let Students Discover the Patterns

Give students a blank integer multiplication chart, similar to the first image below, and a calculator.

Blank integer multiplication chart for discovering sign patternsColored integer multiplication chart showing positive and negative product patterns

Have students use the calculator to complete the multiplication chart. Then ask them to color positive products one color and negative products another color.

Once the chart is complete, guide a discussion with open-ended questions. Ask: What patterns do you notice? Why do you think those patterns happen?

Tip 2: Use Number Lines

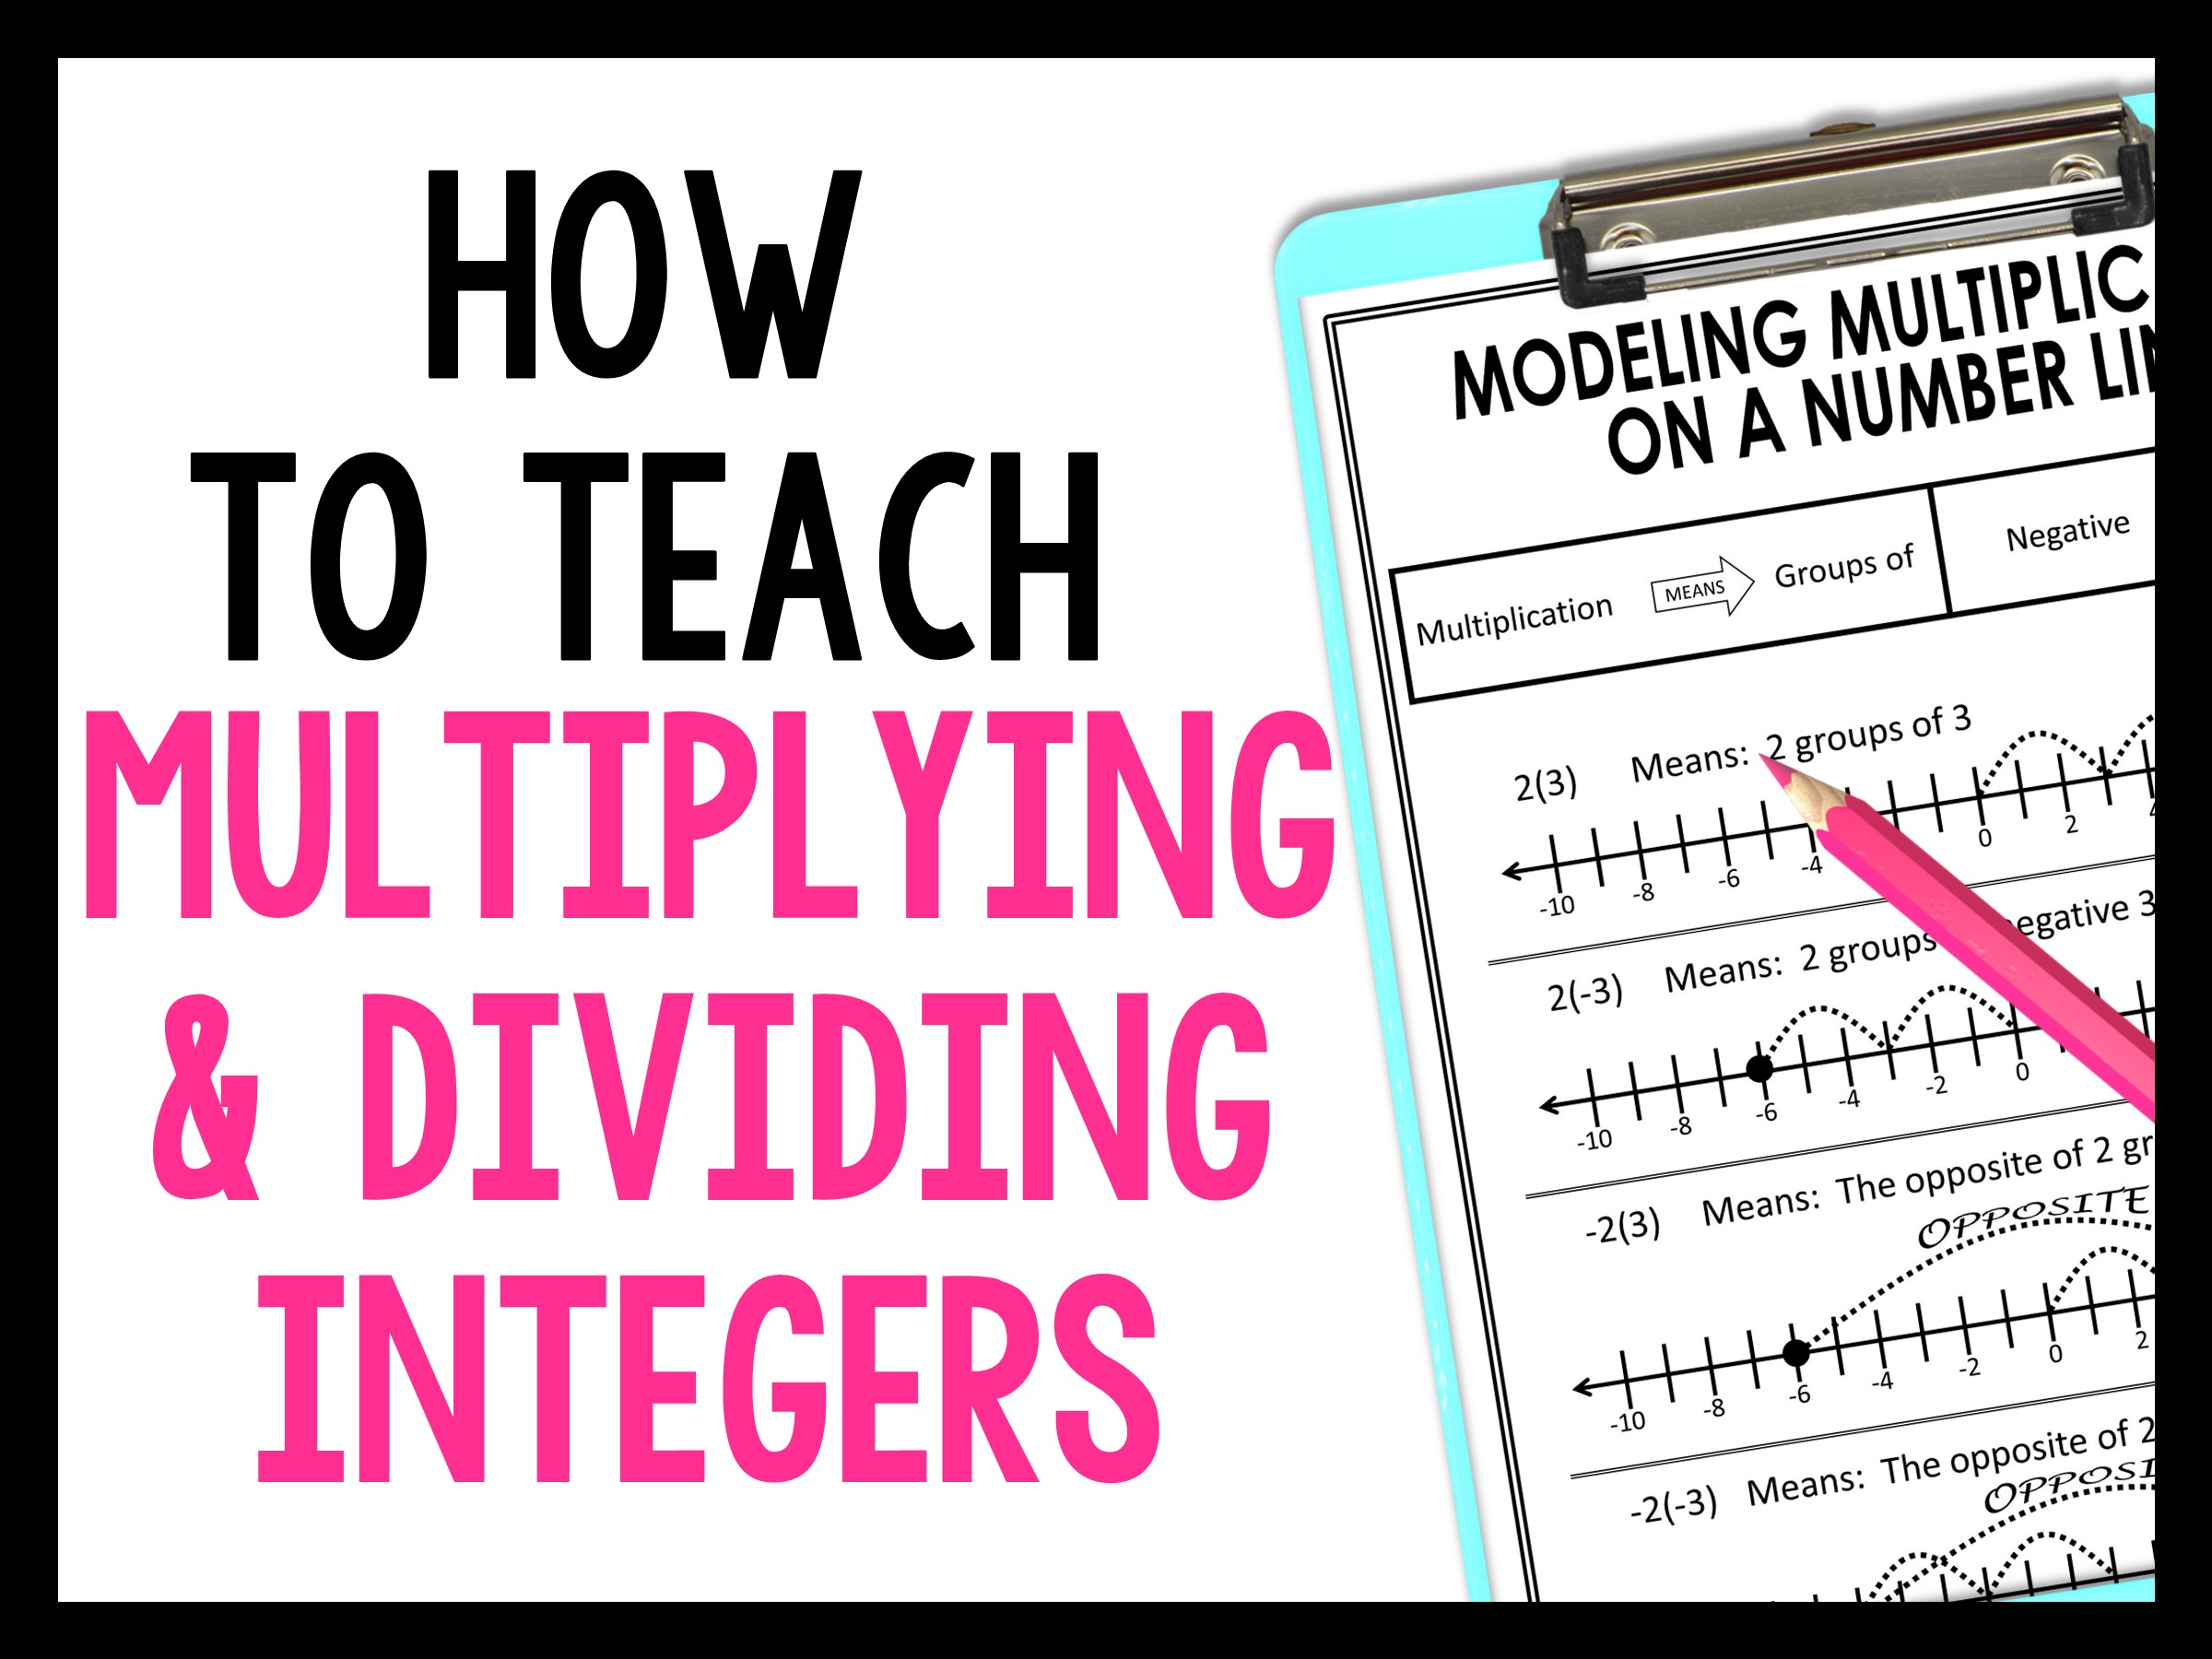
Before using number lines, I discuss multiplication as “groups of” and help students translate an expression into words.

  • 5(2): Five groups of 2
  • 5(−2): Five groups of −2

Then connect those groups to repeated movement on a number line.

Number line visual model for multiplying positive and negative integers

For expressions with a negative first factor, discuss taking the opposite of the corresponding positive-factor product.

  • −5(2): The opposite of five groups of 2
  • −5(−2): The opposite of five groups of −2

This gives students a way to reason about why multiplying two negative integers produces a positive product.

Tip 3: Extend Their Thinking

Once students understand opposites and integer multiplication, extend their thinking to products with more than two factors.

Using factors of 1 and −1 allows students to focus on sign patterns rather than complicated arithmetic.

  • (1)(−1)
  • (−1)(−1)
  • (−1)(−1)(−1)
  • (−1)(−1)(−1)(−1)
  • (−1)(−1)(−1)(−1)(−1)

Have students notice that a product with an even number of negative factors is positive, while a product with an odd number of negative factors is negative. These patterns apply when none of the factors is zero.

Ask students to explain why this pattern works. Include some positive ones to demonstrate that multiplying by 1 doesn't change the sign of the product.

Tip 4: Apply the Reasoning to Division

Once students understand multiplication of integers, help them connect multiplication and division using fact families and inverse operations.

Use questions such as:

  • How are multiplication and division related?
  • How can a multiplication equation help us solve a division equation?
  • Why does dividing by a negative number change the sign of a nonzero quotient?

Students can use the patterns they discovered in multiplication to explain the corresponding rules for integer division.

Integer Operations Guided Notes

If you're looking for ready-to-use resources, my Integer Operations Guided Notes cover addition, subtraction, multiplication, and division of integers using number lines.

They include mathematical models, practice, and opportunities for deeper thinking. See the guided notes on TpT.

7th grade integer operations guided notes using number lines

Multiplying and Dividing Integers Stations

My Multiplying and Dividing Integers Stations are another option for practicing these concepts. They allow students to explore patterns, use number lines, and extend their understanding to division.

Explore the Multiplying and Dividing Integers Stations on TpT.

Multiplying and dividing integers stations activities for 7th grade math

Save These Integer Teaching Strategies

Save these tips and examples to your favorite middle school math Pinterest board for your next integer operations lesson.

How to teach multiplying and dividing integers with multiplication charts and number lines

3 Tips for Teaching Solving and Graphing Inequalities

The Problem

After teaching solving and graphing inequalities for a few years, I noticed my middle school math students kept making the same mistakes.

I started teaching inequalities differently and deliberately having conversations with my students. Those conversations made all the difference.

Now, I call them conversations because the key is not to simply tell students how to solve and graph inequalities. The key is to lead the conversation with thoughtful questions that help students make sense of the mathematics.

Here are three essential conversations to have when teaching inequalities in middle school math.

1. Understand the Difference Between Strict and Inclusive Inequalities

Start by comparing the inequalities x > 7 and x ≥ 8.

Have students graph both solution sets on the same number line. Then ask them whether the graphs represent the same solutions.

An important distinction is whether you're working with integers or real numbers.

If x can be any real number, the two inequalities are different. For example, 7.5 satisfies x > 7, but not x ≥ 8. However, if x is restricted to integers, both inequalities have the same solutions.

Use questions such as:

  • Can you name a number greater than 7 but less than 8?
  • Does that number satisfy both inequalities?
  • Would your answer change if x could only be an integer?
  • What do an open circle and a closed circle tell us about the boundary value?

This discussion helps students understand the meaning of the inequality symbols instead of simply memorizing which circle to draw.

2. Understand Inequalities with the Variable on Either Side

Another essential conversation is comparing x < 7 and 7 > x.

Ask students to think of three numbers that are less than 7. Then ask them to think of three numbers that 7 is greater than.

Do their solutions work for both inequalities? Why?

Have students graph both inequalities and notice that they represent exactly the same solution set.

Give students opportunities to rewrite inequalities with the variable on the left side.

For example:

7 > x   is equivalent to   x < 7

Both forms are mathematically correct. Writing the variable on the left is often helpful for consistency when interpreting and graphing solutions.

The goal is for students to understand why the inequality symbol changes direction when the two sides are switched.

3. Make Sense of Inequality Graphs on a Number Line

There is a more meaningful way to teach graphing inequalities than telling students that the inequality symbol points in the direction the arrow should go.

When students rely on that shortcut, they may not understand what the graph represents. The shortcut can also lead to errors when the variable is written on the right.

Instead, help students understand that the graph represents every number that makes the inequality true.

One strategy is to choose test points. For example, if students are graphing x > 7, have them test a number like 0 and a number like 10.

Zero does not satisfy x > 7, but 10 does. Therefore, the solution extends to the right of 7.

Be careful not to rely on testing zero alone for every inequality. Students should select numbers on either side of the boundary and reason about which values satisfy the inequality.

Ask students:

  • Does this number make the inequality true?
  • What about a number on the other side of the boundary?
  • Should the boundary number be included?
  • How does the arrow represent all the possible solutions?

I often remind students that we cannot list every solution to an inequality. A number line is a visual way to represent the entire solution set.

These conversations can take more time during the initial lesson. However, my experience was that students developed a stronger understanding and needed less reteaching later.

Guided Notes for Teaching Inequalities

Guided notes are a great way to keep your mathematical thinking and classroom conversations organized during instruction.

If you're looking for ready-to-use notes, check out my Solving Inequalities Guided Notes with Rational Numbers for 7th grade math.

Click the image below to learn more about the guided notes on TpT.

Save These Inequality Teaching Tips

Save this article to your favorite middle school math Pinterest board so you can revisit these conversations when teaching solving and graphing inequalities.

How to multiply expressions using algebra tiles in middle school and Algebra 1

Algebra Tiles in the Math Classroom

I had never even heard of algebra tiles until my third year of teaching. Our school invested in a bunch of them, and I quickly had to learn how to use them.

I searched for information about using algebra tiles with students, but I couldn't find much. So I spent time at my desk with the tiles, figuring them out for myself. It was like gold!

Suddenly integers, solving equations, simplifying expressions, factoring trinomials, and multiplying binomials made so much more sense. Algebra tiles became one of my favorite tools for helping students visualize mathematical concepts.

Today, I'm sharing how to use algebra tiles to teach multiplying binomials.

Multiplying Polynomials with Algebra Tiles

Start by reminding students how to find the area of a rectangle. When you multiply two factors, you can think of those factors as the side lengths of a rectangle and the product as the area.

Polynomial multiplication can be represented in the same way. For example, with factors (x + 2) and (x + 3), the product is represented by the area of a rectangle with those side lengths.

Algebra tiles area model for (x + 2)(x + 3) equals x squared plus 5x plus 6

Have students build the model one step at a time:

  • Line up the factor tiles to represent the rectangle's length and width.
  • Fill the area with tiles that match the dimensions of each section.
  • Continue until the rectangle is completely filled.
  • Count and combine the tiles in the rectangle to determine the product of the binomial factors.

More Algebra Tile Multiplication Examples

Students can repeat this same process with other binomial factors. As they build each rectangle, encourage them to explain how the tile dimensions connect to the factors and product.

Algebra tiles model of (x + 2)(2x + 1) equals 2x squared plus 5x plus 2
Algebra tiles model of (x + 1)(x + 4) equals x squared plus 5x plus 4

Activities for Practicing Multiplying Binomials

If you need activities to practice multiplying binomials in your middle school or Algebra 1 classroom, check out these resources. Click on either image to learn more.

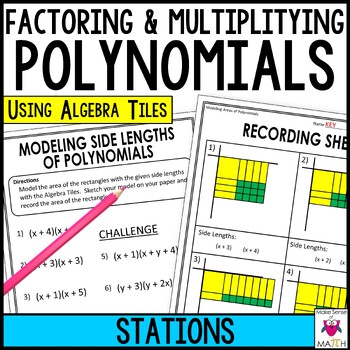
Factoring and Multiplying Polynomials StationsFactors and Models with Algebra Tiles Task Cards

Factoring and Multiplying Polynomials Stations and Factors and Models with Algebra Tiles Task Cards give students additional opportunities to use models and connect them to algebraic expressions.

Free Printable Algebra Tiles

Don't have a class set of algebra tiles? You can start with these printable ones.

Free Printable Algebra Tiles

Get the Free Printable Algebra Tiles on TpT

Save This Article

Save these tips and visual examples to your classroom Pinterest board so you can revisit them when teaching polynomial multiplication and algebra tiles.

How to multiply binomials with algebra tiles using an area model

4 Strategies for Teaching Area of Composite Figures

Finding the area of composite figures is an important skill in middle school math. While some students understand it quickly, others need opportunities to visualize how shapes can be divided and combined.

The goal isn't just for students to memorize area formulas. We want them to understand how those formulas can be used to find the area of more complex shapes.

Here are four strategies to help students make sense of the area of composite figures while developing their problem-solving skills.

1. Review the Area of Basic Shapes

Before introducing composite figures, review how to calculate the area of basic shapes, including rectangles, triangles, and parallelograms.

Make sure students understand what the measurements represent rather than simply substituting numbers into formulas.

For example, when finding the area of a triangle or parallelogram, students should recognize that the base and height must be perpendicular.

This understanding becomes especially important when students begin dividing irregular shapes into smaller parts.

2. Divide Composite Figures into Simpler Shapes

One of the most common strategies for finding the area of composite figures is to divide the figure into smaller, familiar shapes.

Students might divide a composite figure into rectangles, triangles, or parallelograms. They can find the area of each smaller shape and then add the areas together.

What I love about this strategy is that students may divide the same figure in different ways.

Encourage students to compare their approaches. Ask them to explain why different ways of dividing a figure should produce the same total area.

These discussions help students move beyond following a procedure and begin reasoning about how area works.

3. Subtract the Area of a Missing Section

Another useful strategy is to find the area of a larger shape and subtract the area of a section that isn't included in the composite figure.

Instead of dividing the figure into smaller pieces and adding their areas, students can think about the area that needs to be removed.

Take a look at the example below.

To determine the area of the blue L-shaped region, students can find the area of the entire larger square and subtract the area of the smaller yellow square.

This method helps students recognize that area can be determined through both addition and subtraction.

I recommend teaching both approaches and giving students opportunities to decide which method makes the most sense for a particular figure.

4. Incorporate Problem-Solving with Missing Measurements

I always try to incorporate problem-solving into my math lessons, and composite figures provide a great opportunity to do this.

Instead of always giving students every measurement needed to find the area, give them figures where some measurements must be determined using the information provided.

Compare Figures A and B below.

In both figures, students can find the area by determining the area of the rectangle and the triangle.

In Figure A, all the measurements needed are provided. In Figure B, students must use the other dimensions to determine the triangle's perpendicular height.

For example, they must recognize that the height is 10 - 7 = 3.

This small change increases the reasoning required without completely changing the mathematics.

It's also a simple way to differentiate. Students who need more support can begin with clearly labeled measurements, while students who are ready for a challenge can work with missing dimensions.

Practice Finding the Area of Composite Figures

Looking for an engaging way to give students practice finding the area of composite figures?

My Area of Composite Figures Activity includes two versions so you can meet students where they are.

Version 1: All the necessary measurements are provided so students can focus on dividing figures into smaller shapes and calculating area.

Version 2: Some measurements are missing, requiring students to use problem-solving skills to determine the dimensions they need.

You can use these versions to provide additional support or challenge students who are ready to apply their understanding.

Final Thoughts

Teaching the area of composite figures is about more than helping students memorize formulas. We want students to understand how shapes are composed and how they can use what they already know to solve unfamiliar problems.

Encourage students to divide figures in different ways, compare strategies, and explain their reasoning.

When students understand how area works, they can apply their thinking to new and more challenging problems.

Save These Composite Figures Teaching Ideas to Pinterest!

Want to remember these four strategies? Save this post to your middle school math Pinterest board so you can come back to these teaching ideas when planning your next lesson.

Hover over the image below and click the Pinterest Save button to pin it for later!

Back to Top